Best AI Tools for Data Analysis: Free and Paid Solutions Compared
Published: 3 Jun 2026
Choosing the right tool can feel confusing when there are so many options claiming to handle data faster and smarter. Many people struggle to understand which tool truly fits their needs, especially when each platform offers different features, pricing, and levels of complexity. Businesses today rely heavily on data to make decisions, but without the right tools, managing large amounts of information can become slow, difficult, and overwhelming. This is why selecting the right solution is an important step for anyone who wants to turn raw data into useful insights.
In this guide, we will explore the best AI tools for data analysis and help you understand what makes them valuable in real-world use. We will look at how these tools improve speed, accuracy, and accessibility, and what key features you should consider before choosing one. You will also learn how different tools support data visualization, real-time insights, and easy integration with multiple data sources, so you can confidently decide which option suits your needs best.
What are data analysis tools?
Data analysis tools are software or programs that help in collecting, cleaning, organizing, analyzing, and interpreting large sets of data to derive meaningful insights. They make it easier to convert raw information into clear and useful results that support better understanding and decision-making.
These tools use different techniques to extract valuable information from data, such as:
- Statistical analysis to identify patterns, trends, and relationships in numbers
- Machine learning algorithms to discover hidden connections and make predictions
- Data visualization to present information through charts, graphs, and dashboards for easy understanding
Importance and Benefits of AI Tools for Data Analysis
- Faster Processing – They can analyze large amounts of data in a very short time.
- Improved Accuracy – They reduce human errors and identify patterns that are difficult to detect manually.
- Time Saving – They automate repetitive tasks like data cleaning, sorting, and reporting.
- Better Decision Making – They provide clear insights that help organizations make informed decisions.
- Predictive Capability – They help forecast future trends based on past data.
- Easy Accessibility – They allow even non-technical users to understand and use data.
- Handling Large Data – They can manage and process very large and complex datasets easily.
- Cost Efficiency – They reduce manual labor and operational costs over time.
Features of AI Data Analysis Tools
- Data Integration – Ability to collect and combine data from multiple sources like databases, spreadsheets, and cloud systems.
- Data Visualization – Provides interactive charts, graphs, and dashboards to present complex information in an easy way.
- Automation – Automatically performs tasks such as data cleaning, sorting, and report generation.
- Real-Time Analysis – Allows users to monitor and analyze live data for quick decision-making.
- Ease of Use – Designed with simple interfaces so even non-technical users can use them easily.
- Customization – Lets users adjust settings and workflows according to their specific needs.
- Security and Access Control – Protects sensitive data by managing user roles and permissions.
- Scalability – Can handle increasing amounts of data as business needs grow.
Types of AI Tools for Data Analysis (Free vs Paid)
AI tools for data analysis can be classified on the basis of cost into free and paid categories. This classification helps users choose tools according to their budget, needs, and level of usage.
Free AI Data Analysis Tools
Free tools are available without any cost and are mostly used by students, beginners, and small organizations. They provide basic features that help users collect, organize, and analyze data. These tools are easy to access and are useful for learning, small projects, and simple data tasks.
However, they may have limitations such as fewer advanced features, restricted storage, or limited automation.Following are the free AI tools for data analysis
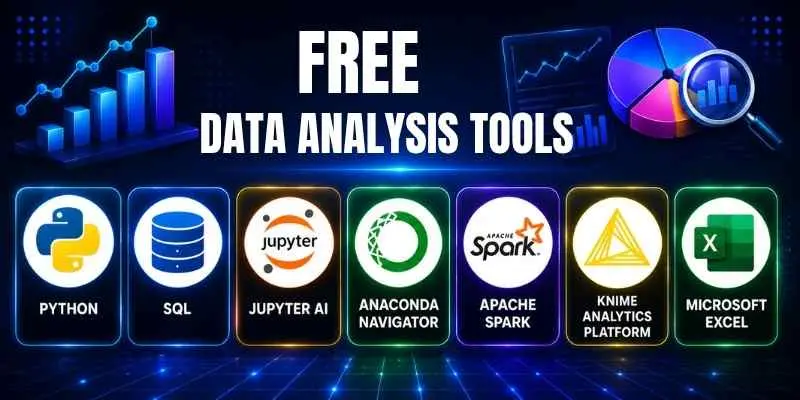
- Python
- SQL
- Jupyter AI
- Anaconda Navigator
- Apache Spark
- KNIME Analytics Platform
- Basic Microsoft Excel
Python
Python is a widely used and beginner-friendly tool for data analysis because it is simple to understand and very flexible. It helps users work with large amounts of data by allowing them to collect, clean, organize, and study information in an easy way. Many students, analysts, and businesses prefer Python because it saves time, handles data accurately, and can be used for both small tasks and large projects. It also supports many built-in libraries that make data work faster and more efficient.
Python in data analysis includes:
- ETL Processes (Extract, Transform, Load): Python helps in extracting data from different sources, cleaning it, and preparing it for analysis.
- Data Visualization: It is used to create clear graphs, charts, and plots to present findings in an easy way.
- Machine Learning: Python supports building predictive models using methods like linear regression and decision trees.
- Web Scraping: It can collect data automatically from websites for analysis.
- Handling Large Data: Python can manage and process very large datasets efficiently.
- Automation of Tasks: It helps automate repetitive tasks like data cleaning and report generation.
Best For: Beginners, analysts, and developers who need a flexible tool to handle large datasets, create visual reports, and perform data analysis tasks easily
SQL
SQL is a widely used tool for working with data stored in databases. It helps users find, organize, and manage large amounts of information in a simple and structured way. Many businesses rely on SQL because most of their data is stored in database systems, and SQL makes it easy to access and study that data. It uses simple commands that allow users to search for specific records, sort information, and combine data from different tables. SQL also helps keep data accurate and organized, which makes it easier to understand and use for decision-making.
SQL in data analysis includes:
- Data Retrieval: It helps users quickly search and extract specific information from large databases.
- Data Filtering and Sorting: It allows users to arrange data in order and remove unnecessary records.
- Data Updating: SQL helps modify, add, or delete data when needed.
- Combining Data: It can merge information from multiple tables to create complete reports.
- Data Cleaning: It helps remove duplicate records and correct errors.
- Handling Large Data: SQL can efficiently manage very large datasets stored in database systems.
Best For: Businesses and analysts who need to quickly search, manage, and analyze structured data stored in databases.
Jupyter AI
Jupyter AI is a tool that helps users work with data in an interactive and organized way. It is mainly used through notebooks where users can write code, run it step by step, and see the results immediately. This makes it very helpful for learning, experimenting, and analyzing data because users can test ideas and make changes easily. Many students, researchers, and data professionals prefer Jupyter because it allows them to combine code, notes, and results in one place, which makes their work clear and easy to follow.
Jupyter AI also supports working with large datasets and helps users perform tasks like cleaning data, analyzing numbers, and creating visual reports. It allows users to use different programming languages, but it is most commonly used with Python. Another advantage is that it shows results instantly, such as tables, charts, and graphs, which helps users understand data better. Overall, it is a simple and flexible tool that makes data analysis more organized and easier to manage.
Jupyter AI in data analysis includes:
- Interactive Data Work: Allows users to run code step by step and see results instantly.
- Data Cleaning and Processing: Helps organize and prepare data for proper analysis.
- Data Visualization: Supports creating charts, graphs, and tables within the notebook.
- Experimentation: Users can test ideas and make quick changes easily.
- Multiple Language Support: Works mainly with Python but supports other languages as well.
- Organized Workflow: Combines code, results, and notes in one document.
Best For: Students, researchers, and data learners who want an interactive environment to run code step by step and view results instantly.
Anaconda Navigator
Anaconda Navigator is a simple platform that helps users manage tools needed for data analysis in one place. It provides an easy interface where users can install, open, and organize different software without writing complex commands. Many beginners prefer Anaconda Navigator because it removes the difficulty of setting up data analysis tools manually. It allows users to work with programming environments, manage libraries, and handle data projects in a more organized way.
Another advantage of Anaconda Navigator is that it supports working with large datasets and helps users prepare data for analysis. It makes it easy to install useful packages like those used for calculations, charts, and data management. Users can also switch between different projects smoothly without affecting other work. Overall, it is a helpful platform that saves time, keeps tools organized, and makes data analysis setup much easier.
Anaconda Navigator in data analysis includes:
- Easy Software Management: Allows users to install and manage data tools in one place.
- Library Support: Helps install useful packages for calculations, charts, and data handling.
- Environment Management: Lets users create separate workspaces for different projects.
- Data Preparation: Supports cleaning and organizing data before analysis.
- Large Data Handling: Works efficiently with big datasets.
- User-Friendly Interface: Provides a simple visual interface instead of complex commands.
Best For: Beginners, students, and data learners who want an easy way to install, manage, and organize data analysis tools in one place.
Apache Spark
Apache Spark is a powerful tool used for working with very large amounts of data quickly. It is designed to process data much faster than traditional systems because it can handle many tasks at the same time. Many companies use Apache Spark when they need to analyze huge datasets such as business records, customer data, or online activity logs. It helps users organize, process, and study data in an efficient way without long delays.
Another important feature of Apache Spark is its ability to work with data from different sources like databases, files, and cloud storage. It can process both real-time data and stored data, which makes it useful for monitoring ongoing activities as well as studying past information. It also supports creating reports, running calculations, and preparing data for further analysis. Overall, Apache Spark is known for its speed, reliability, and ability to handle complex data tasks on a large scale.
Apache Spark in data analysis includes:
- Fast Data Processing: Handles very large datasets quickly.
- Parallel Processing: Works on multiple tasks at the same time to save time.
- Data Integration: Can collect data from different sources such as databases and cloud storage.
- Real-Time Data Handling: Supports analyzing live data as it is generated.
- Batch Data Processing: Helps analyze stored data for reports and insights.
- Scalable Performance: Can manage growing amounts of data easily.
Best For: Large organizations and data teams that need to process huge datasets quickly and handle real-time data efficiently.
KNIME Analytics Platform
KNIME Analytics Platform is a user-friendly tool that helps people analyze data without needing to write complex code. It works through a visual system where users can drag and drop different steps to build a complete data workflow. This makes it very helpful for beginners and non-technical users who want to work with data in a simple and organized way. Many businesses and learners use KNIME because it allows them to collect, clean, and study data in one place.
Another advantage of KNIME is that it can connect with many data sources such as spreadsheets, databases, and cloud storage. It helps users prepare data, perform calculations, and create clear reports through charts and visual dashboards. KNIME also allows users to handle large datasets and automate repetitive data tasks. Overall, it is known for its simplicity, flexibility, and ability to make data analysis easier without heavy technical knowledge.
KNIME in data analysis includes:
- Visual Workflow System: Uses drag-and-drop steps to build data processes easily.
- Data Integration: Can connect with multiple sources like files, databases, and cloud platforms.
- Data Cleaning and Preparation: Helps organize and fix data before analysis.
- Data Visualization: Supports creating charts, graphs, and dashboards.
- Automation of Tasks: Allows users to repeat analysis steps automatically.
- Large Data Handling: Works efficiently with big datasets.
Best For: Beginners, business users, and analysts who want a simple visual tool to analyze data without coding.
Microsoft Excel (Basic)
Microsoft Excel is one of the most widely used tools for working with data in a simple and organized way. It allows users to store information in rows and columns, which makes it easy to manage and understand. Many students, offices, and businesses use Excel because it is easy to learn and does not require technical skills. It helps users perform calculations, sort data, and create reports quickly.
Excel also provides built-in formulas and functions that make it easier to analyze numbers and perform repetitive calculations. Users can create charts, graphs, and tables to present data clearly. Another advantage is that it allows users to filter, organize, and update data easily. It can also handle a large amount of information, which makes it useful for everyday business tasks and basic data analysis work.
Microsoft Excel in data analysis includes:
- Data Organization: Stores data in rows and columns for easy management.
- Formulas and Functions: Performs automatic calculations and data analysis.
- Data Sorting and Filtering: Helps arrange and find specific information quickly.
- Data Visualization: Allows users to create charts, graphs, and tables.
- Data Cleaning: Helps remove duplicate records and correct errors.
- Report Creation: Supports preparing summaries and simple reports.
Best For: Students, office workers, and small businesses who need a simple tool for basic data organization and analysis.
Paid AI Data Analysis Tools
Paid tools require a subscription or payment and offer advanced features for professional use. These tools are commonly used by businesses and large organizations because they can handle complex data, provide strong security, and offer real-time insights.
They also support better integration, customization, and scalability for growing data needs.Following are the paid AI tools for data analysis
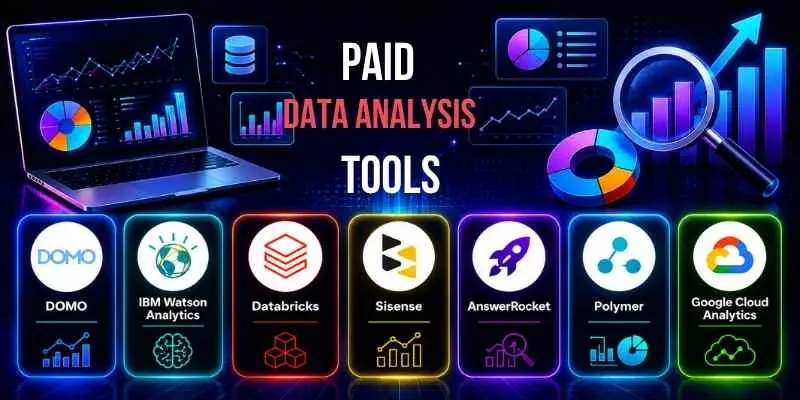
- GigaSpaces eRAG
- Domo
- IBM Watson Analytics
- Databricks
- Sisense
- AnswerRocket
- Polymer
- Google Cloud Smart Analytics
GigaSpaces eRAG
GigaSpaces eRAG is a modern data analysis tool designed to help organizations work with large and complex data in a faster and more organized way. It allows businesses to connect data from different sources and view everything in one place, which helps them understand their overall performance clearly. This tool is especially useful when companies need quick answers from large amounts of information without spending too much time preparing or organizing the data manually.
Another important advantage of eRAG is that it helps users explore data using simple natural language questions instead of complicated commands. It can analyze live data from multiple sources at the same time, which helps organizations make quick decisions. It also provides strong security features to protect sensitive information and allows users to create clear dashboards and reports to identify trends, risks, and opportunities. Overall, it is known for its speed, flexibility, and ability to simplify complex data analysis tasks.
GigaSpaces eRAG in data analysis includes:
- Multi-Source Data Integration: Connects and combines data from different systems in one place.
- Fast Data Processing: Handles very large datasets quickly.
- Natural Language Queries: Allows users to ask questions in simple language to explore data.
- Real-Time Data Analysis: Supports working with live data from multiple sources.
- Data Visualization: Provides dashboards and reports to present insights clearly.
- Strong Data Security: Protects sensitive data with controlled access.
- Flexible Data Exploration: Allows users to analyze data without complex preparation.
Best For: Large businesses and data teams that need fast insights from multiple live data sources with strong security and easy data exploration.
Domo
Domo is a cloud-based data analysis tool that helps organizations collect, manage, and study data from different sources in one place. It allows businesses to connect their data from systems like spreadsheets, databases, and online platforms so they can see everything together. This makes it easier for companies to track their performance, monitor activities, and understand trends without switching between multiple tools.
Another useful feature of Domo is that it provides clear dashboards and reports that help users understand data quickly. It supports real-time data updates, which means users can monitor current business activities and respond faster to changes. Domo also helps automate routine data tasks, saving time and reducing manual work. Overall, it is known for its ability to simplify data management and present information in an easy-to-understand way.
Domo in data analysis includes:
- Data Integration: Connects data from multiple sources into one platform.
- Real-Time Data Monitoring: Allows users to track live business data.
- Data Visualization: Provides dashboards, charts, and reports for clear insights.
- Automated Data Processing: Reduces manual work by automating routine tasks.
- Cloud Access: Enables users to access data from anywhere through the internet.
- Performance Tracking: Helps businesses monitor operations and results.
Best For: Businesses and marketing teams that need an easy way to monitor performance and view real-time data in clear dashboards.
IBM Watson Analytics
IBM Watson Analytics is a data analysis tool that helps organizations understand large amounts of data in a simple and organized way. It allows users to collect data from different sources, study it, and turn it into clear reports and visual dashboards. Many businesses use this tool because it helps them quickly find patterns, trends, and useful information that support better planning and decision-making.
Another advantage of IBM Watson Analytics is that it makes data exploration easier by allowing users to search and analyze information without complex technical steps. It can handle both structured data like tables and unstructured data such as text. The tool also helps users prepare data by cleaning and organizing it before analysis. Overall, it is known for simplifying complex data work and helping organizations gain clear insights from their information.
IBM Watson Analytics in data analysis includes:
- Data Integration: Combines data from multiple sources in one place.
- Data Preparation: Helps clean and organize data before analysis.
- Data Visualization: Creates dashboards, charts, and visual reports.
- Pattern Identification: Helps find trends and useful information in data.
- Handling Different Data Types: Works with both structured and text-based data.
- Automated Reporting: Generates reports to support decision-making.
Best For: Large organizations and business teams that need to analyze complex data and create clear reports for decision-making.
Databricks
Databricks is a powerful data analysis platform that helps organizations process and study very large amounts of data in one place. It allows users to store, organize, and work with data from different sources such as databases, files, and cloud storage. Many companies use Databricks because it can handle huge datasets quickly and helps teams work together on the same data projects. It is designed to support both data preparation and detailed analysis without slowing down performance.
Another important feature of Databricks is that it provides a shared workspace where multiple users can collaborate and view results in real time. It helps users clean data, run calculations, and prepare reports efficiently. The platform also supports real-time data processing, which allows businesses to monitor current activities and respond quickly to changes. Overall, Databricks is known for its speed, strong performance, and ability to manage complex data tasks at a large scale.
Databricks in data analysis includes:
- Large Data Processing: Handles very large datasets efficiently.
- Data Integration: Connects data from multiple sources in one platform.
- Collaborative Workspace: Allows teams to work together on data projects.
- Real-Time Data Processing: Supports analyzing live data quickly.
- Data Preparation: Helps clean and organize data before analysis.
- High Performance: Processes complex data tasks with speed and reliability.
Best For: Large organizations and data teams that need to process huge datasets and collaborate on complex data projects efficiently.
Sisense
Sisense is a data analysis tool that helps organizations collect, study, and present large amounts of information in a clear way. It allows users to bring data from different sources into one system so they can view everything together. Many businesses use Sisense because it helps them turn complex data into simple dashboards and reports that are easy to understand. This makes it easier to track performance, monitor activities, and find useful insights for decision-making.
Another advantage of Sisense is its ability to handle very large datasets without slowing down. It helps users prepare data by cleaning and organizing it before analysis. The tool also allows users to create interactive dashboards that can be shared with teams to improve collaboration. Overall, Sisense is known for simplifying complex data work and helping organizations understand their data more clearly.
Sisense in data analysis includes:
- Data Integration: Combines data from multiple sources into one platform.
- Large Data Handling: Processes very large datasets efficiently.
- Data Preparation: Helps clean and organize data before analysis.
- Interactive Dashboards: Creates visual reports that are easy to understand.
- Data Sharing: Allows teams to share dashboards and insights.
- Performance Monitoring: Helps track business results and trends.
Best For: Businesses and organizations that need to analyze large datasets and create interactive dashboards for clear decision-making.
AnswerRocket
AnswerRocket is a data analysis tool that helps organizations quickly find answers from their data without complex technical steps. It allows users to search and explore information by asking questions in simple language, which makes it easier for non-technical users to understand their data. Many businesses use AnswerRocket because it helps them save time and get quick insights from large datasets without needing detailed manual analysis.
Another advantage of AnswerRocket is that it can connect with multiple data sources and bring all information into one place. It helps users generate reports, identify patterns, and track business performance easily. The tool also supports automated reporting, which reduces manual work and ensures that users receive updated insights regularly. Overall, AnswerRocket is known for making data exploration simple, fast, and easy to understand.
AnswerRocket in data analysis includes:
- Simple Data Search: Allows users to explore data by asking questions in plain language.
- Data Integration: Connects data from different sources into one platform.
- Automated Reporting: Generates reports automatically to save time.
- Pattern Identification: Helps find trends and useful insights in data.
- Performance Tracking: Supports monitoring business activities and results.
- Easy Data Exploration: Makes it simple for non-technical users to analyze data.
Best For: Business teams and managers who need quick answers and simple reports from large datasets without complex technical work.
Polymer
Polymer is a data analysis tool that helps users turn raw data into clear and easy-to-understand visual reports. It allows people to upload data from spreadsheets or other sources and quickly convert it into dashboards, charts, and summaries. Many businesses and professionals use Polymer because it simplifies data work and helps them understand information without needing complex technical steps.
Another advantage of Polymer is that it automatically organizes and prepares data for analysis, which saves time and reduces manual effort. It helps users explore their data, identify trends, and create reports that can be shared with teams. The tool also supports working with different types of data and allows users to update dashboards easily as new information becomes available. Overall, Polymer is known for making data visualization and reporting simple and fast.
Polymer in data analysis includes:
- Data Upload and Integration: Allows users to import data from spreadsheets and other sources.
- Automatic Data Preparation: Organizes and cleans data for analysis.
- Data Visualization: Creates dashboards, charts, and visual reports.
- Trend Identification: Helps users find patterns and insights in data.
- Easy Report Sharing: Allows users to share dashboards with teams.
- Simple Interface: Provides an easy way to explore data without technical complexity.
Best For: Small businesses and teams who want a simple tool to quickly convert data into clear visual reports and dashboards.
Google Cloud Smart Analytics
Google Cloud Smart Analytics is a data analysis platform that helps organizations store, manage, and study large amounts of data using cloud technology. It allows users to collect data from different sources such as files, databases, and online systems, and bring everything together in one place. Many businesses use this platform because it helps them work with data without needing to maintain their own physical servers.
Another advantage of Google Cloud Smart Analytics is that it provides tools for organizing data, creating reports, and monitoring business performance. It supports real-time data processing, which allows users to track current activities and respond quickly to changes. The platform also offers strong data security and allows teams to access data from anywhere through the internet. Overall, it is known for its flexibility, reliability, and ability to handle very large datasets efficiently.
Google Cloud Smart Analytics in data analysis includes:
- Cloud Data Storage: Stores large amounts of data securely online.
- Data Integration: Connects data from multiple sources into one platform.
- Real-Time Data Processing: Supports monitoring live data.
- Data Visualization: Helps create dashboards, charts, and reports.
- Remote Access: Allows users to access data from anywhere.
- Strong Security: Protects sensitive data with controlled access.
Best For: Large organizations and businesses that need secure cloud-based data storage and real-time data analysis.
Tools with Both Free and Paid Versions
Some tools provide a free basic version along with paid plans for advanced features.following are the tools with both versions
- Microsoft Power BI
- Tableau
- Julius AI
- KNIME (enterprise version)
Microsoft Power BI
Microsoft Power BI is a data analysis tool that helps users turn raw data into clear and meaningful reports. It allows people to collect data from different sources such as spreadsheets, databases, and online systems, and bring everything together in one place. Many businesses use Power BI because it helps them understand their data through simple dashboards and visual reports. It is available in both free and paid versions, where the free version is suitable for basic analysis and the paid version provides advanced sharing and collaboration features.
Another important feature of Power BI is its ability to update data automatically, which helps users monitor current activities without manual effort. It also provides interactive dashboards that allow users to explore data easily by filtering and sorting information. The tool supports large datasets and helps organizations track performance, identify trends, and create professional reports. Overall, Power BI is known for making data visualization and reporting simple, organized, and accessible.
Microsoft Power BI in data analysis includes:
- Data Integration: Connects data from multiple sources into one platform.
- Interactive Dashboards: Creates visual reports that are easy to explore.
- Automatic Data Updates: Refreshes data regularly without manual work.
- Data Visualization: Provides charts, graphs, and tables for clear insights.
- Data Sharing: Allows users to share reports with teams.
- Large Data Handling: Supports working with large datasets efficiently.
Best For: Businesses and analysts who need a simple tool to create interactive dashboards and share reports easily.
Tableau
Tableau is a popular data analysis tool that helps users turn complex data into clear and interactive visual reports. It allows people to connect data from different sources such as spreadsheets, databases, and cloud systems, and present it through easy-to-understand dashboards. Many businesses use Tableau because it makes data easier to explore and helps users quickly identify patterns, trends, and important information.
Tableau is available in both free and paid versions. The free version is useful for learning and basic data visualization, while the paid versions offer advanced features such as sharing reports, real-time data updates, and team collaboration. The tool is known for its simple drag-and-drop system, which allows users to create charts and dashboards without writing complex commands. Overall, Tableau helps organizations present data in a visual and organized way to support better understanding and decision-making.
Tableau in data analysis includes:
- Data Integration: Connects data from multiple sources into one platform.
- Drag-and-Drop Interface: Allows users to create reports easily without complex steps.
- Data Visualization: Creates interactive charts, graphs, and dashboards.
- Real-Time Data Updates: Supports working with current data.
- Report Sharing: Allows users to share dashboards with teams.
- Trend Identification: Helps users find patterns and insights in data.
Best For: Businesses and analysts who need a powerful tool to create interactive visual dashboards and present data clearly.
Julius AI
Julius AI is a data analysis tool that helps users quickly understand their data by turning it into clear charts, reports, and summaries. It allows people to upload data from spreadsheets or files and then explore it in a simple way. Many users prefer Julius AI because it reduces the effort needed to organize and study data, making the process faster and easier. It is available in both free and paid versions, where the free version offers basic features and the paid version provides more advanced options.
Another advantage of Julius AI is that it helps users clean and prepare their data automatically before analysis. It also allows users to create visual reports and identify trends without complicated steps. The tool supports working with different types of data and provides simple ways to update reports when new information is added. Overall, Julius AI is known for making data exploration simple, quick, and easy to understand.
Julius AI in data analysis includes:
- Data Upload: Allows users to import data from spreadsheets and files.
- Automatic Data Preparation: Organizes and cleans data for analysis.
- Data Visualization: Creates charts, graphs, and visual reports.
- Trend Identification: Helps users find patterns and insights in data.
- Easy Report Updates: Allows users to refresh reports when new data is added.
- Simple Interface: Makes data exploration easy for beginners.
Best For: Students, beginners, and small teams who want a simple tool to quickly turn data into visual reports and insights.
KNIME (Enterprise Version)
KNIME Enterprise Version is an advanced form of the KNIME Analytics Platform that is designed for organizations that need to manage large data projects and team collaboration. It provides additional features that help businesses control data access, share workflows, and monitor data processes more efficiently. Many companies use the enterprise version because it allows multiple users to work together while keeping data secure and well organized.
Another important benefit of KNIME Enterprise is its ability to automate complex data tasks and handle very large datasets smoothly. It supports connecting to many different data sources and allows teams to schedule workflows so that data processes run automatically. The platform also offers better performance, stronger security controls, and centralized management tools, which make it suitable for business environments. Overall, it is known for improving teamwork, managing large data operations, and ensuring secure data handling.
KNIME Enterprise in data analysis includes:
- Team Collaboration: Allows multiple users to share and manage workflows.
- Centralized Management: Provides control over data processes in one place.
- Data Integration: Connects with multiple data sources and systems.
- Workflow Automation: Enables automatic execution of data tasks.
- Large Data Handling: Supports working with very large datasets efficiently.
- Security Controls: Helps manage user access and protect sensitive data.
Best For: Organizations and data teams that need a secure platform for managing large data projects and collaborative workflows.
Which Data Analysis Tool Is Right for You?
Choosing the right data analysis tool depends mainly on your specific needs and goals. Every tool offers different features, so it is important to consider factors such as your level of technical skills, the size of your data, and the type of work you want to perform. Some tools are designed for beginners and simple reporting, while others are built for handling complex and large-scale data tasks.
For example, Tableau is a great option if you want an easy-to-use tool with strong data visualization features. Python is a popular choice for users who need flexibility and advanced data handling capabilities. Cloud-based tools like Google Cloud Analytics are suitable for organizations that need scalable solutions and team collaboration. Meanwhile, KNIME is a good option for both beginners and experienced users because of its visual workflow system and ability to handle different types of data tasks.
Facts About AI Data Analysis Tools
- They can process very large amounts of data much faster than manual methods.
- They help reduce human errors by identifying patterns and inconsistencies automatically.
- They can work with different types of data such as numbers, text, images, and online records.
- They make data easier to understand through charts, dashboards, and visual reports.
- Many tools allow users to connect data from multiple sources in one place.
- They help organizations make faster and more accurate decisions based on real data.
- Some tools can analyze live data in real time for quick monitoring.
- They are becoming easier to use, allowing even non-technical users to explore data.
conclusion
In this guide, we have explored the best AI tools for data analysis and learned how they help people collect, organize, study, and understand large amounts of data. We also looked at their types, features, benefits, and how different tools are suitable for different needs, whether for beginners, students, or businesses. From simple tools like Excel and Python to advanced platforms like Tableau and Power BI, each tool plays an important role in making data easier to understand and use.
My personal recommendation is to always choose a tool based on your needs and skill level. If you are just starting, begin with simple and free tools, and then move to advanced ones as your work grows. Understanding and using the right data tool is very important today because it helps you make smarter decisions and work more efficiently.
That’s all for now, folks. Keep learning, keep exploring, and stay tuned for more helpful guides like this.
FAQs
1. In what ways do modern data analysis tools make tasks easier than older methods?
They can process massive amounts of information very quickly and reduce manual effort. They also help users discover patterns and useful insights that would take much longer to find using traditional approaches.
2. What types of data can these tools work with?
They can handle many forms of information, including numbers, written content, images, and online records. They are also capable of working with both well-organized and unstructured data.
3. Can these tools connect with existing systems and platforms?
Yes, most tools can link with databases, spreadsheets, cloud storage, and business software. This makes it easy to gather and analyze data from different sources in one place.
4. How much do these tools usually cost?
The price depends on the features and usage level. Some tools are free to use, while others require a subscription for advanced options and larger data capacity.
5. Are these tools suitable for beginners?
Many platforms are designed with simple dashboards and easy controls. Even users with limited technical knowledge can start using them and learn gradually.
6. Do these tools support live data tracking?
Yes, many of them can process real-time information and provide instant updates. This helps organizations monitor activities and respond quickly.
7. Can they handle very large datasets?
Yes, these tools are built to manage and process huge amounts of data efficiently. This makes them useful for both business and research purposes.
8. How do they support better decision-making?
They provide clear reports, visual dashboards, and reliable insights. This helps users understand situations clearly and make confident decisions based on data






- Be Respectful
- Stay Relevant
- Stay Positive
- True Feedback
- Encourage Discussion
- Avoid Spamming
- No Fake News
- Don't Copy-Paste
- No Personal Attacks
- Be Respectful
- Stay Relevant
- Stay Positive
- True Feedback
- Encourage Discussion
- Avoid Spamming
- No Fake News
- Don't Copy-Paste
- No Personal Attacks
